Taste the Air
To stop both ecological and climate breakdown we have to change our system that is eating our planet. To contribute to more awareness Lab AIR visualizes the aerial matter, such as nitrogen oxides and carbon oxide, that cannot be seen. First see and feel. Then believe and act.
What does CO2 look like? Our daily choices cause carbon emissions. The maximum emission to prevent global warming more than 1,5ºC and to prevent a climate catastrophe, is known. What volumes are we talking about? It has a bitter taste, this discussions on goals… and not meeting them for so long after the alarming report ‘Limits of growth’ written in 1972 by the Club of Rome.
The ‘Taste the air’ invites to meet these elements in an immersive installation and sparkling conversations. This installation and workshop was presented at Alcova Milano as part of SMB’s exhibition WaterSchool - Garden of Delight, during the Milan Design Week 2022.
Showing consumption based CO2 footprints per capita makes quantities understandable and relatable. A necessary step in social consensus to move industries and politicians with most impact.
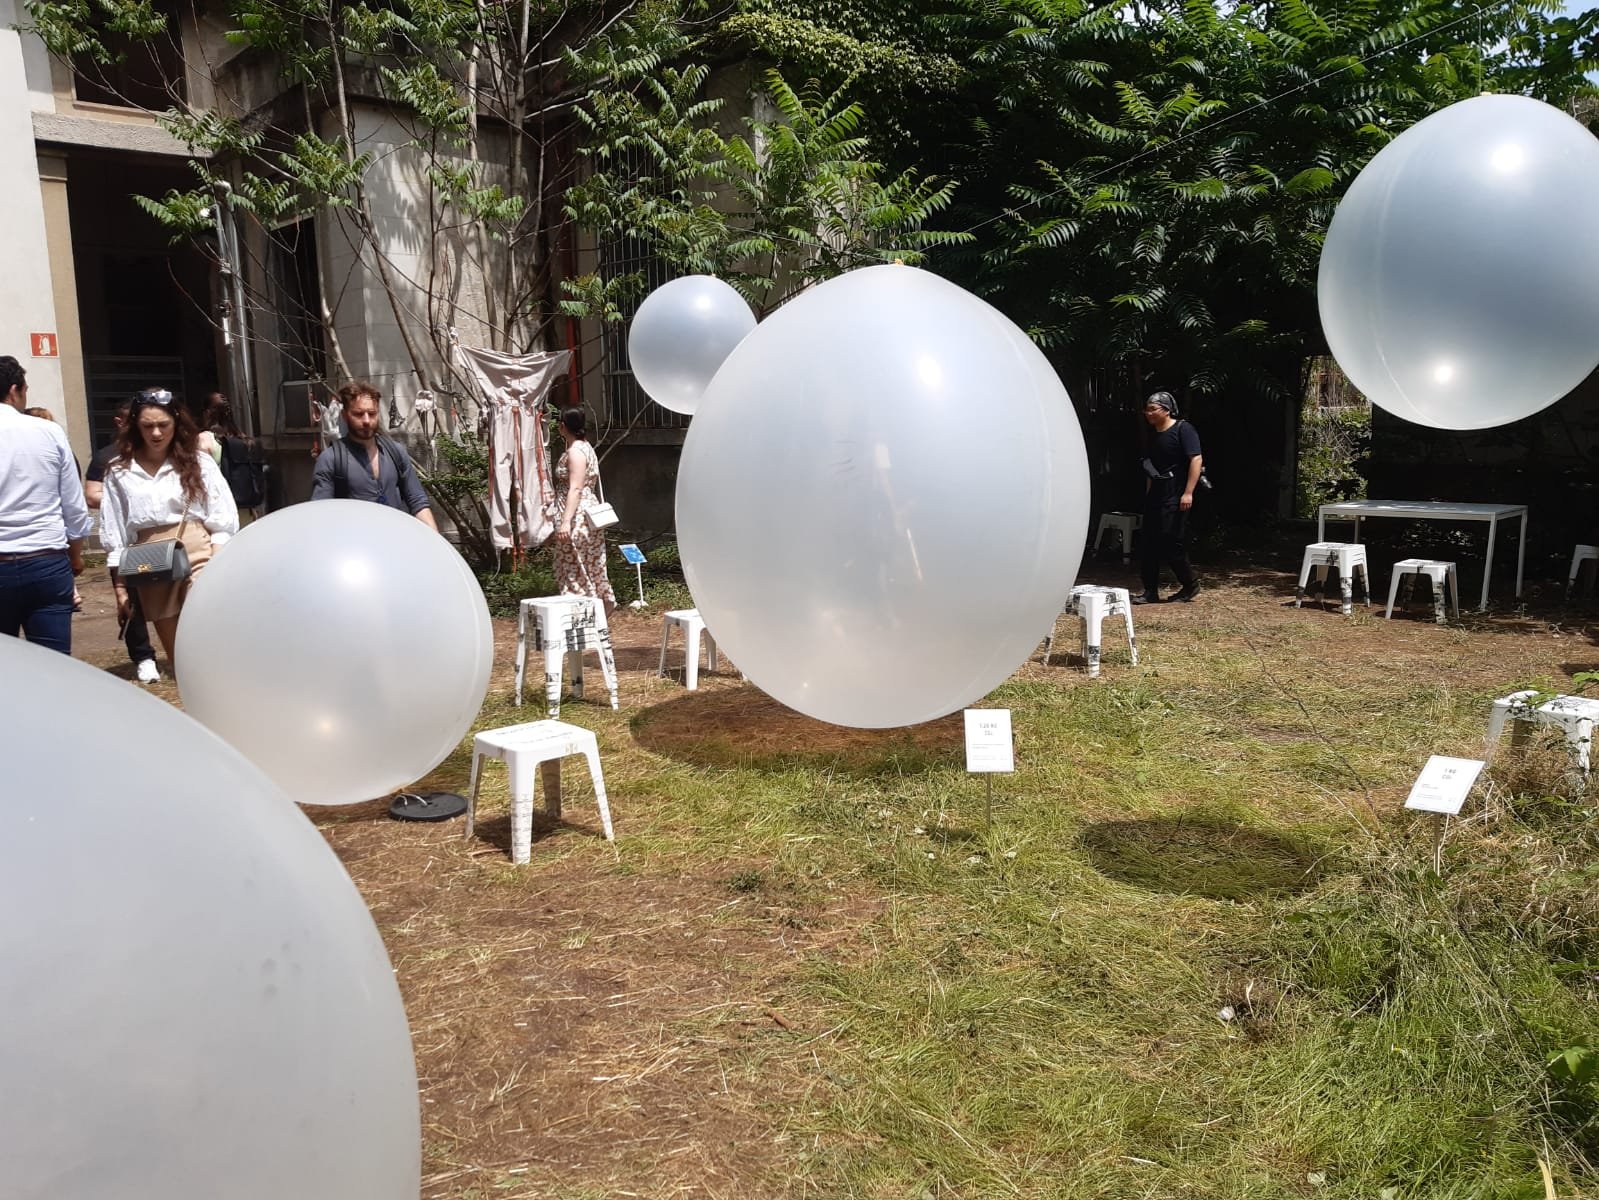
The installations of balloons shows a data visualization of our CO2 footprint of daily choices, for one person. The global average consumption based CO2 per capita per day is 13,15 kg, which fits in a balloon 2,4 m in diameter.
The maximum global average consumption based CO2 per capita per day to keep global warming below 1,5 ºC (Paris agreement) can not exceed 5,75 kg. This is a balloon 1,8 m in diameter.

Lab AIR installed an open kitchen together with Foret Atelier , to actually taste these threatening greenhouse gases. A mousse stirred with Milanese air, and whipped cream made with nitrogen and CO2. What a differences in taste and yet both so familiar. Whilst tasting we have seen many amazed - and by times a bit sour- faces. Embodied knowledge!

